An event that looks full on the calendar and brings money into the till has not necessarily made a profit. After kitchen costs, staff shifts, outside services and discounts are deducted, what is left is often different from what you expected. Profitability analysis means seeing that difference event by event; only this analysis tells you which event type, which session or which package really pays off. Below you will find a post-event closing checklist, the measures to track and a reporting rhythm.
Revenue is not profit
A simple frame can be enough: event contribution is revenue minus discounts minus the costs that can be tied directly to that event. Allocate overheads such as rent, fixed salaries and depreciation separately, on the total.
| Item | Type | Source | Watch out for |
|---|---|---|---|
| Venue fee | Revenue | Venue package or manually entered price | Work with the amount excluding VAT |
| Package and product sales | Revenue | Sales table | Varies with the guest count |
| Service items | Revenue | Fixed-price services | If supplied by an outside party, record the cost separately |
| Discounts | Reduces revenue | Recorded discounts | Track by reason |
| Cancellation charge | Revenue | Cancellation settlement | Confirm its tax nature with your accountant |
| Kitchen and materials | Cost | Purchasing and stock | Relate it to the guest count |
| Staff | Cost | Shifts and overtime | Include setup and teardown |
| Outside services | Cost | Contracted suppliers | Tie them to the event |
| Energy, cleaning, consumables | Cost | Monthly expense records | Allocate a reasonable share per event |
Prices are often entered including VAT, so compare revenue using amounts excluding VAT; otherwise the profit looks higher than it is. For VAT and invoicing, confirm current legislation with your accountant.
The same revenue, a different profit
Imagine two events that bring in the same amount. One has a high guest count, a discounted package and a long service shift; the other has fewer guests, some extra-service sales and a short shift. Even if total revenue is equal, the kitchen and staff cost of the first may be much higher. A report that looks only at turnover puts forward the job that took more effort; a report that looks at contribution shows the right job. Try it with your own data: rank your last ten events first by revenue and then by contribution, and compare the two rankings.
Post-event closing checklist
Complete these seven steps within the first week after the event:
- Enter the actual guest count and verify the billable number against the rule in the contract.
- Record items added during the event and any damage on the booking.
- Collect the remaining balance or tie it to a payment plan.
- Check that the final invoice and accounting entry are ready.
- Record kitchen, staff and outside-service costs against the event.
- Compare the products deducted from stock, or left over, with a count.
- Ask the customer for feedback and record the team's notes.
Measures to track
| Measure | How it is calculated | What it tells you |
|---|---|---|
| Revenue per guest | Revenue divided by actual guests | Efficiency of the package and guest count |
| Session occupancy | Confirmed sessions divided by total sessions | Use of capacity |
| Discount share | Total discounts divided by total list price | Effect of the discount policy |
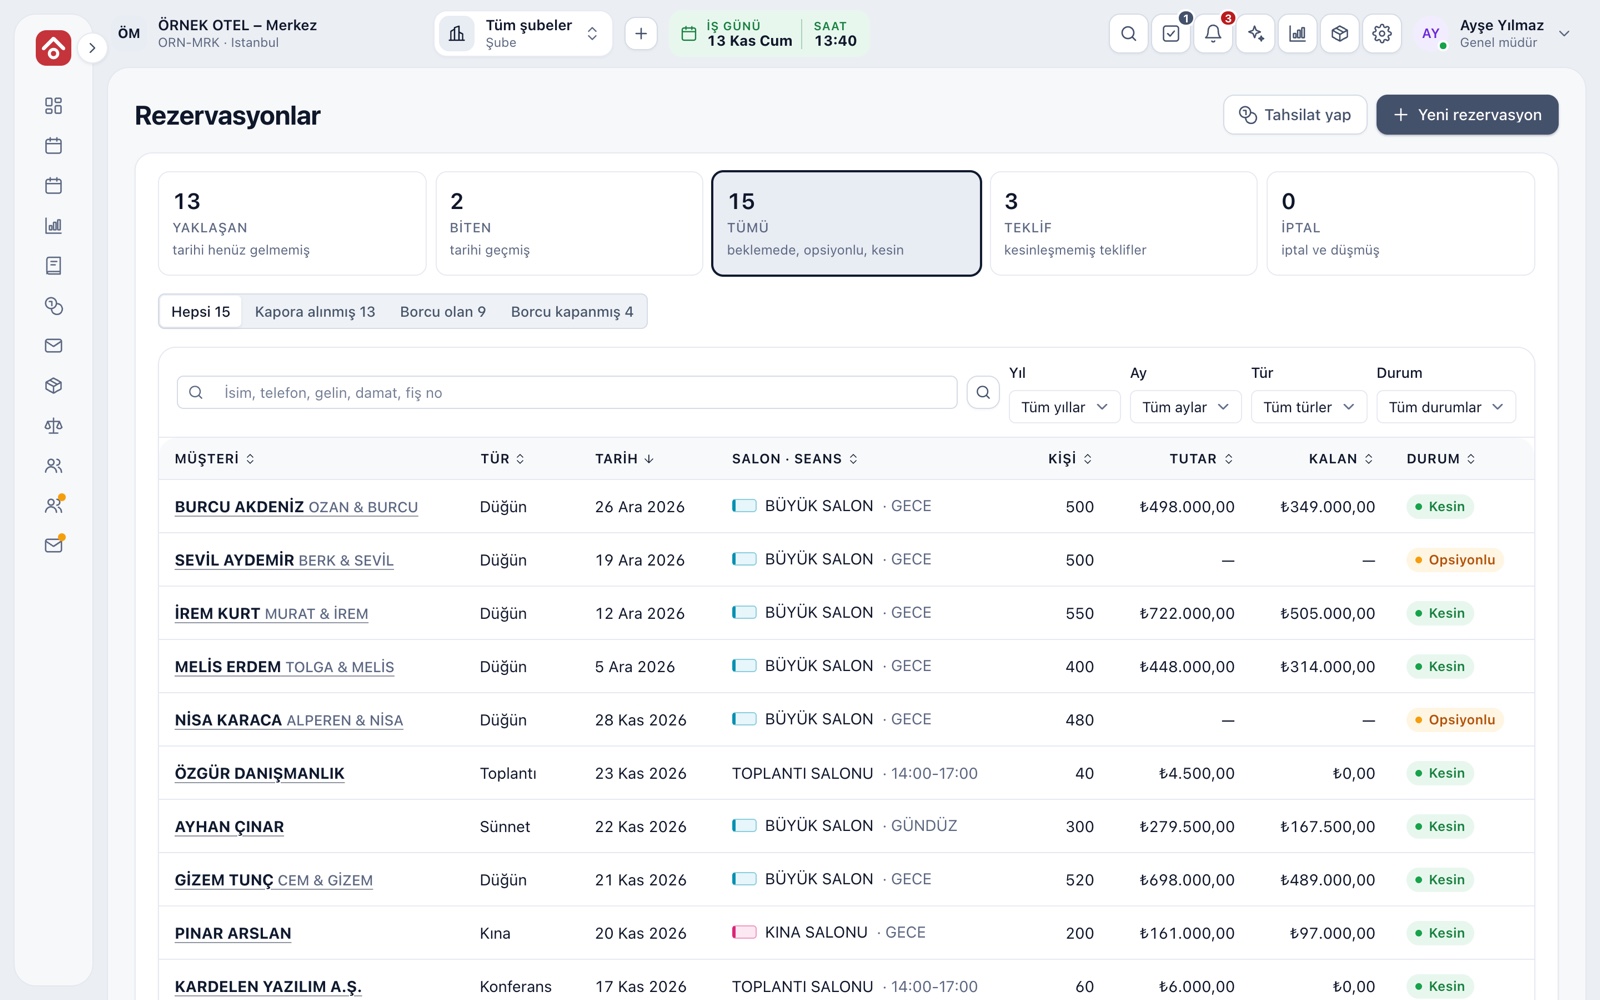
| Conversion | Inquiries that became contracts divided by inquiries received | Sales effectiveness |
| Collection delay | Overdue amount and average days late | Health of cash flow |
| Crew load | Number of assignments per person | Balance of workload |
| Contribution by type | Net contribution by event type | Which type pays off |
Read the measures by comparing period against period, not in a single period. The result of one event may be chance; the average of ten events is a trend. Set targets from your own history too: comparing "with the same period last year" is far more meaningful than comparing with other businesses' averages, because your venue's capacity and customer profile show up only in your own data.
Reporting rhythm
- First week after the event: Closing checklist and contribution per event.
- Monthly: Occupancy, collections and overdue report; crew load.
- End of season and end of year: Year-on-year comparison; distribution by type, venue and month; price and package decisions.
Three questions that turn analysis into decisions
- Which type, session and day contribute the most? Aim your marketing and calendar decisions there.
- Which package or product works with a low contribution? Review its price, contents or cost.
- Which discount is eating profit? Look by reason, and drop the ones that do not work.
Which reports are available in software?
The weddyus Reports page gives these views:
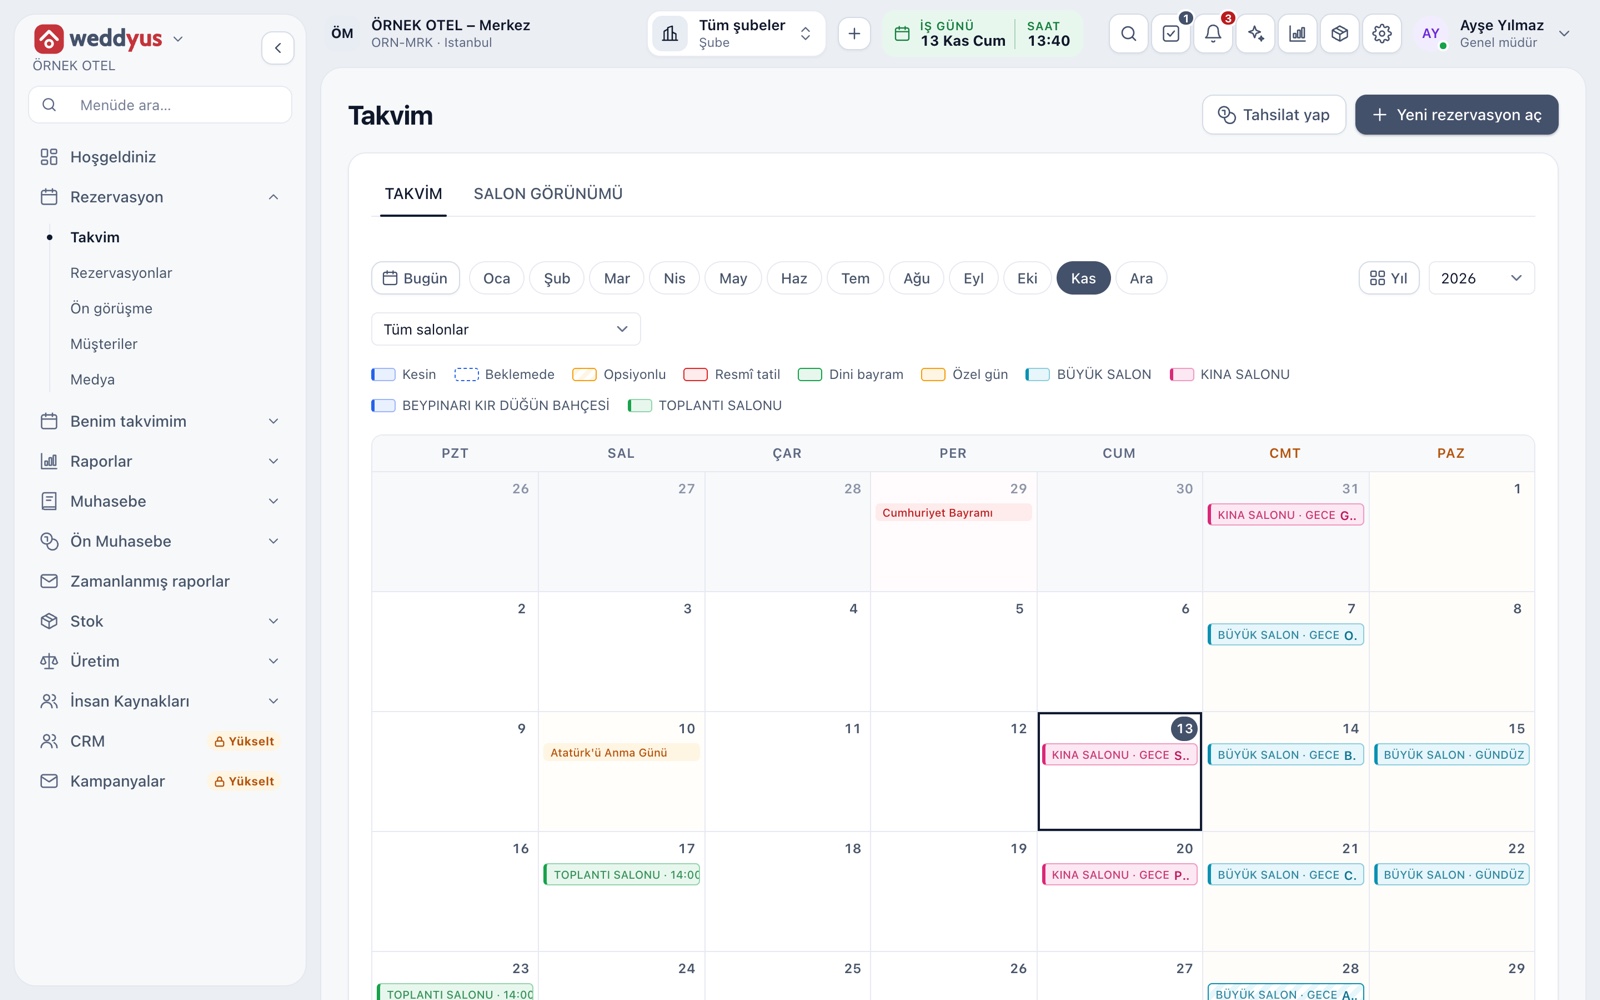
- Bookings and occupancy: Confirmed and held occupancy; by venue, event type and month.
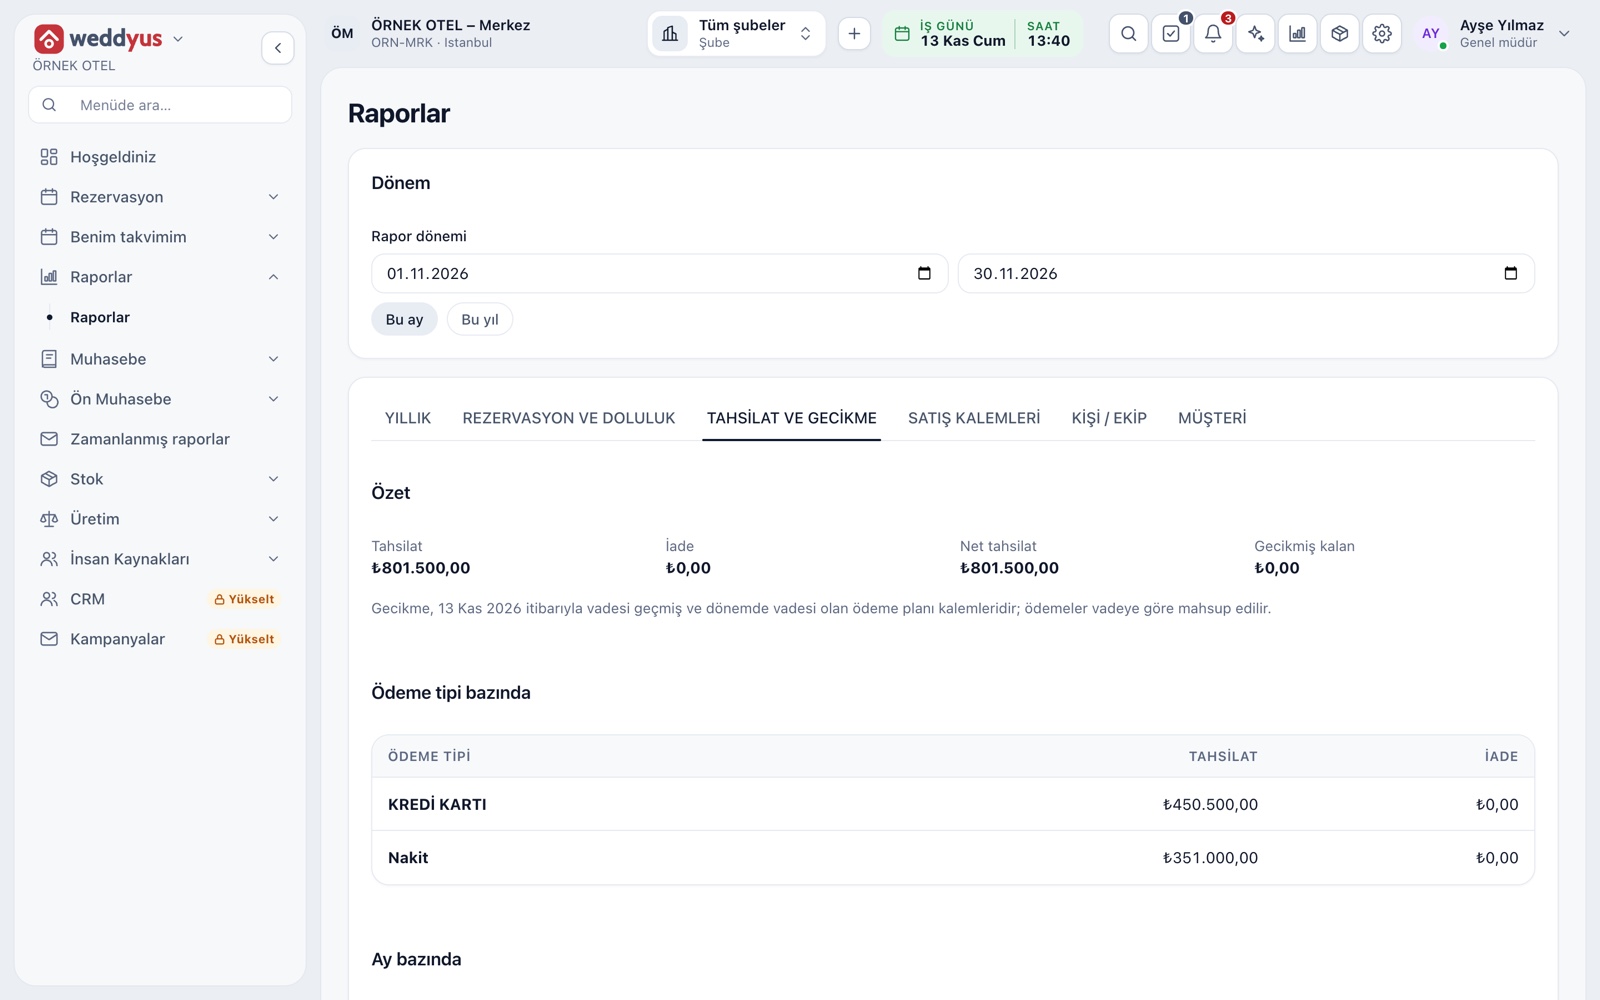
- Collections and overdue: Collections, refunds and net collections; overdue balance and aging.
- Sales items: Sales items of confirmed bookings with an event in the period.
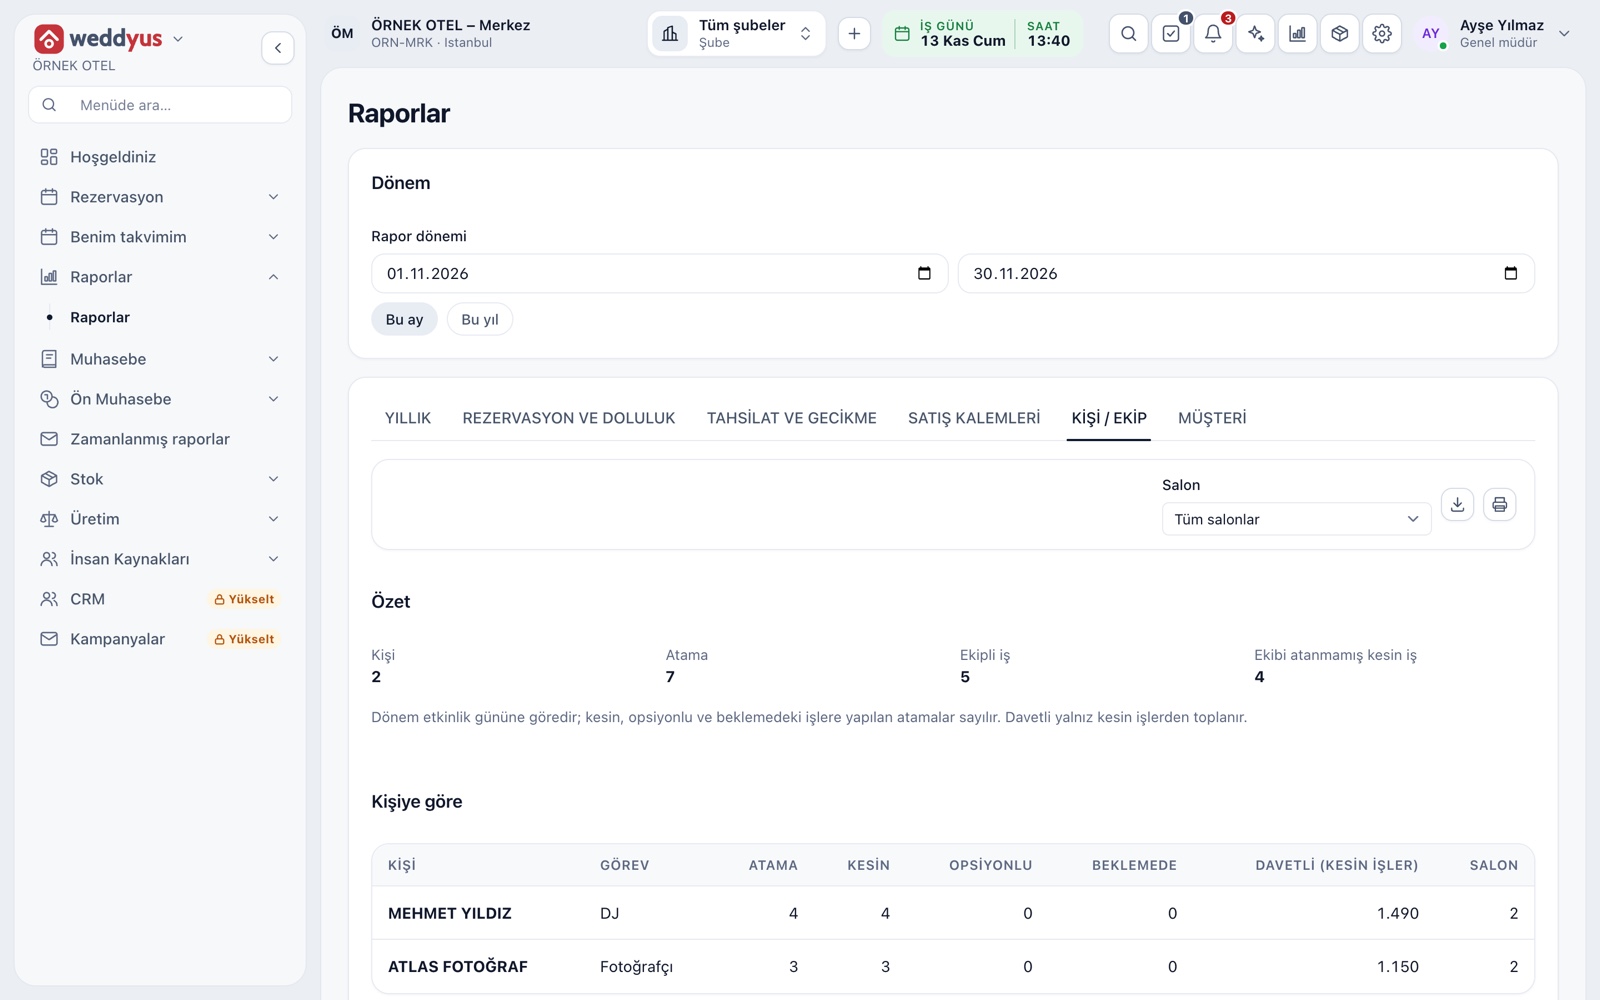
- People / Crew: Assignments and guest numbers by person; confirmed jobs with no crew assigned.
- Customers: Jobs, amounts and remaining balance by customer.
- Yearly reports: Overview, guest numbers, monthly income and distribution by venue; difference from last year and a matrix of the month a booking was made against the event month.
The yearly, people / crew and customer reports offer Excel, CSV and PDF export as well as printing. The inquiry screen shows the conversion percentage. After the event takes place, revenue and VAT are posted to accounting and the final invoice appears on the "to be invoiced" list. You can keep costs per event in your own spreadsheet or accounting program and compare them with event revenue.
Conclusion
Seeing profitability does not require a magic new report; a regular closing habit, a few measures and period-on-period comparison are enough. If your system already records the revenue side, tying the costs to the same event leads you to the right decision. For details of the report screens, see the Venue Reports page.